Massachusetts New Covid Cases per Week
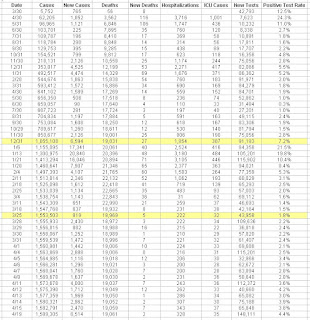
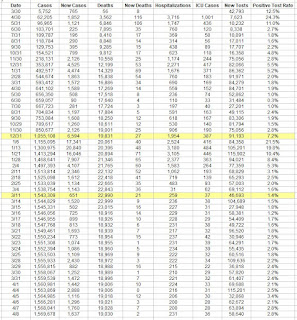
The graph of Massachusetts cases per week shows an interesting tale. We were way high at the beginning of the year, and then that started dropping dramatically, until it leveled off in the middle of February. In March cases started rising again, and then at the beginning of April the effects of vaccination started taking hold. You have to go back to September to see lower case levels than we've got now. As long as the trends depicted here continue we should be out of the woods pretty quick.


Comments
Post a Comment